Nearly every public sector institution across North America (and around the world I presume) has a Deferred Capital Renewal and Maintenance (DCRM) Backlog problem. This is the result of decade long underfunding of capital renewal (and maintenance as well). The ultimate payoff of any IAM program is getting more budget to address your DCRM backlog.
Securing additional funding is about taking all of this complex technical data and telling a story to an audience that typically knows little about facilities. I am not going to dive too deep into Telling your Asset Management Story as I have done so in previous posts. The folks that hold the purse strings are often finance professionals, educators, healthcare providers, politicians, etc. Coming at them with a bunch of technical data is a sure-fire way to get ignored.
Knowing your specific audience is why we recommend you get your stakeholders involved in developing your prioritization. This way, they see themselves in the story you tell based on the priority you developed.
It is critical that you present your current needs while also providing a look into the future based on different funding scenarios. Today could be bad, but 10 years from now could be much, much worse. Alternatively, you could have a large amount of DCRM currently, but the increase over time is not that great as most things are already in your DCRM. It is critical that you provide a snapshot of not just today, but the next 10 to 20 years (or further depending on how far into the future your organization looks).
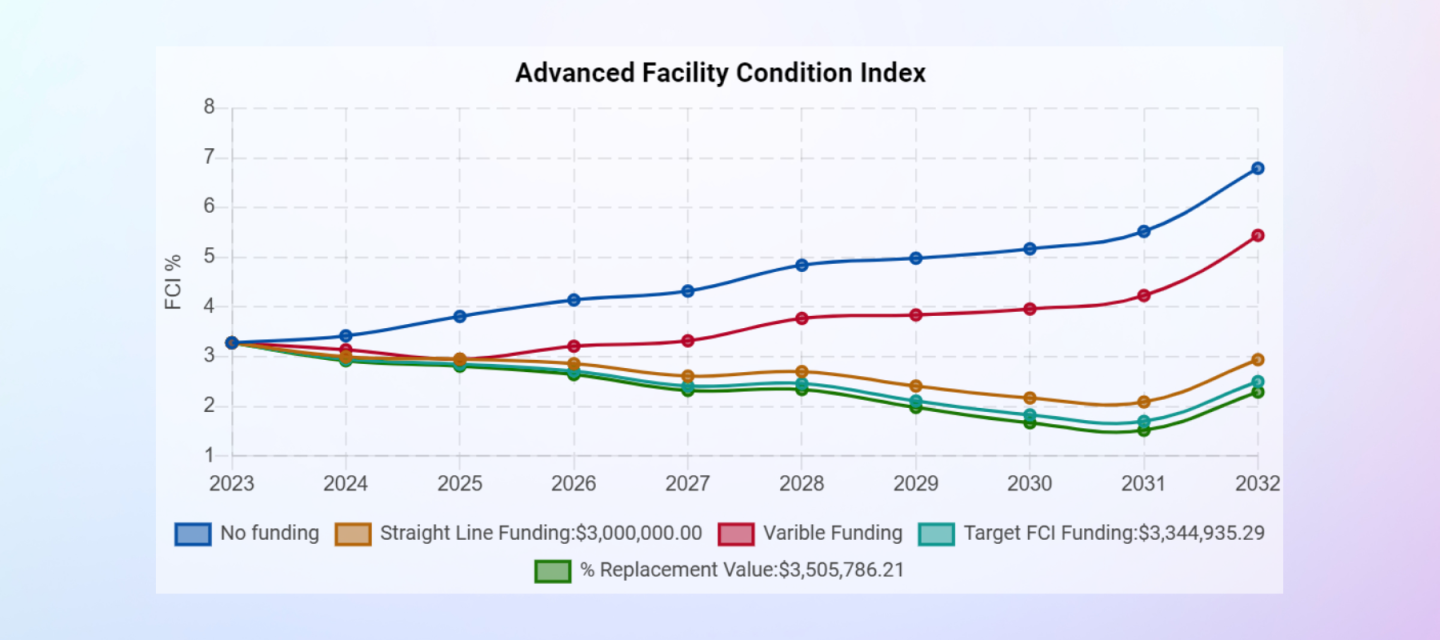
For example, the graph above provides a Facility Condition Index (FCI) funding forecast based on five different funding scenarios. No funding (what if we do nothing), Straight Line Funding (what if we invest the same amount every year), Variable Funding (what if we get a one-time or short term increase in funding and then revert to the norm), Target FCI (how much funding is needed over 10 years to hit a specific FCI) and Percent of Replacement Value (what if we invest a certain percentage of our total CRV in annual renewal).
They say pictures are worth a thousand words. Pictures like the one above can be worth a million dollars, literally. Turning data into graphs and stories will help your stakeholders to better understand your facility and asset management needs and processes. In many cases, we have seen clients be able to take their story and end up getting increased funding for DCRM, which can overtime start to bend the curve and allow you to improve your facilities or campus.
The final consideration that clients need to make is not just how much do I need, but how much can I actually do? Where DCRM numbers are so large that they become hard to comprehend, we recommend (especially in the early days of the evolution of an IAM program) that you focus more on what work you could realistically accomplish while still getting value for your money.
By starting a bit smaller, you are setting your team up for a higher likelihood of success and therefore you can start to build momentum. In addition, as you build capacity on your team you can start to absorb more funding each year in terms of capacity to do work. This can create an “upward spiral” as opposed to securing too much money that is not spent wisely, creating distrust and resulting in future funding cuts. Sometimes it is better to walk before you run.
Next time we will focus on how IAM can help you build greater trust through the budgeting and funding process, even if it does not result in you securing additional funding.


