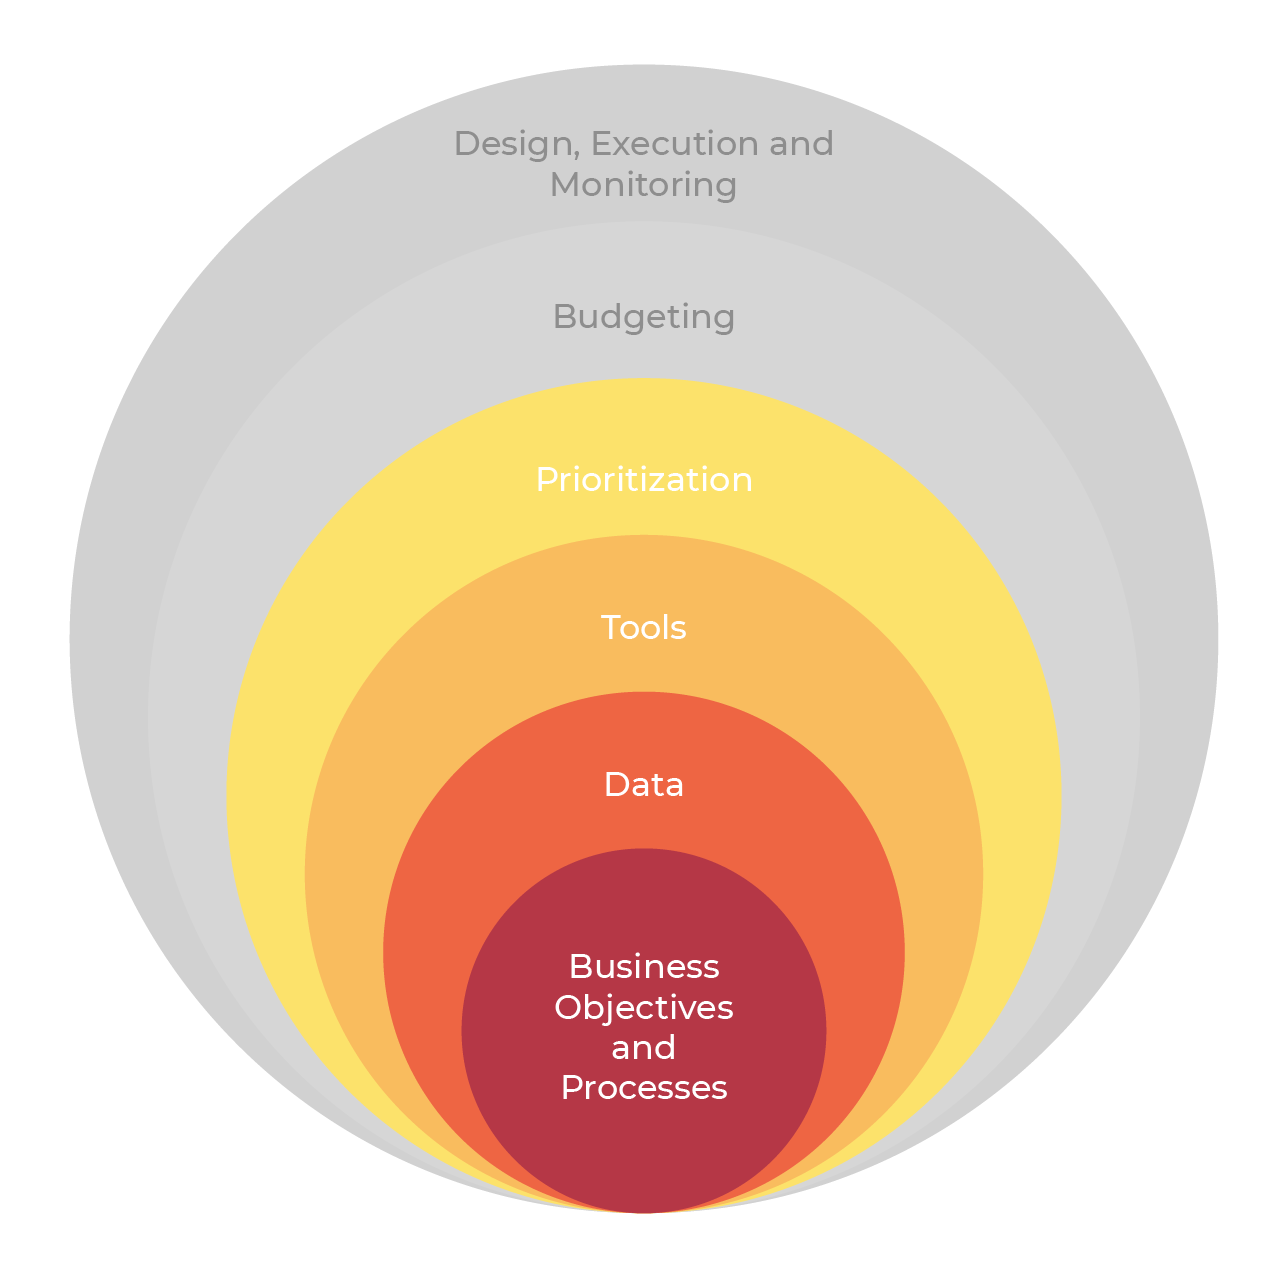
A nearly universal challenge that organizations face is a lack of sufficient funding to address current Deferred Capital Renewal and Maintenance (DCRM) backlog. No matter what level of funding you have, it is almost never enough. As such, determining the best place(s) to invest your limited capital dollars is vitally important for any facility and asset manager to achieve the highest value for money that is possible.
Defining the “best place” and “highest value” for your organization is the foundation of prioritization. It is not a universal formula that everyone can use. For prioritization to truly to work and provide you with the best decision support, it must be tailored to your organizational objectives and processes (the “core of the onion”), draw upon the dataset that have available and are managing (Layer 2 of the onion), and be supported by the tools and technology that you have chosen (Layer 3 of the onion).
With the competition for capital continuing to intensify as assets age, energy/resource prices rise, and government regulation becomes more intense, simplistic “High, Medium and Low” or other categorical prioritization methodologies employed are no longer sufficient to manage portfolio risks.
Most organizations lack the capital funding required to address even their “High” needs, not to mention Medium or Low priorities. How can you answer the question “Which High is Higher than High” based purely on categorical priority.
To go beyond simple categories, organizations need to develop a numerical priority system, which will allow you to rank order your recommendations. There are two primary methods that can be used to develop a numerical priority for facility and asset data in today’s market. I am sure there are other statistical models that could be applied. However, as I am not a master statistician, I will focus on what we see in the market today.
The first approach is Pair Wise analysis, which is where you compare criteria against each other to determine which is preferred (A vs. B, A vs. C, B vs. C). For more on Pair Wise, click the link above to go to the Wikipedia page. Using statistical analysis based on the pair wise comparisons you can develop a score for a specific item or criteria. The benefit of Pair Wise is that it is a recognized statistical process. However, the drawback for facility and asset management professionals is that most of us are not statisticians (it is fairly complex), the process is difficult to configure and revise over time as priorities change (removing or changing one criteria requires that you redo all of the comparisons within the calculation), and it can be seen as a bit of a black box in terms of how the final number was calculated.
The second method is fundamentally a weighted categorical calculation. At Roth IAMS we call it Multivariable Prioritization or MVP. A client develops a series of priority categories based on key decision-making criteria that are used or there is a desire to use when selecting which needs will get integrated into a capital plan (e.g. risk management, impact to users, regulatory, etc.). Assets and elements are then ranked and scored within a tailored scoring system for each criteria. Each category is given a weight based on its overall importance (each category is generally not created equal) to the organization. Based on these scorings and weightings each need provided in a dataset is given a numerical priority score. The drawback of this approach is that it can be overly simplistic if the categories are simple as well. However, it is fairly intuitive to understand and when categories and scoring are done with care, stakeholders from across an organization (facility professionals and lay people) can generally understand the basis of the priority.
With a numerical priority score or number, you are no longer stuck in a categorical world of trying to sort out which projects to do when you run out of money in the middle of a category. However, there is more to prioritization and capital planning than just numerical priority. My next post will dive into the idea of priority as a decision support tool as opposed to a decision-making tool.


