
Scaling the Pyramid
Over the past two weeks I have made the case that AI is only as good as the data you feed it, and the human focus required to stay firmly in the driver’s seat when it comes to reviewing and acting on AI recommendations. If you have not read Parts 1 and 2 yet, I encourage you to start there. Today I want to get practical. What does a good dataset actually look like for a facility and asset management program?
At Roth IAMS, we use a framework we call the Data Hierarchy Pyramid to answer exactly that question. This is not a new concept, in fact it has been around since 2014 back when the company started. Although it is not a new concept, it is more important than ever, given the importance of good data when leveraging AI.
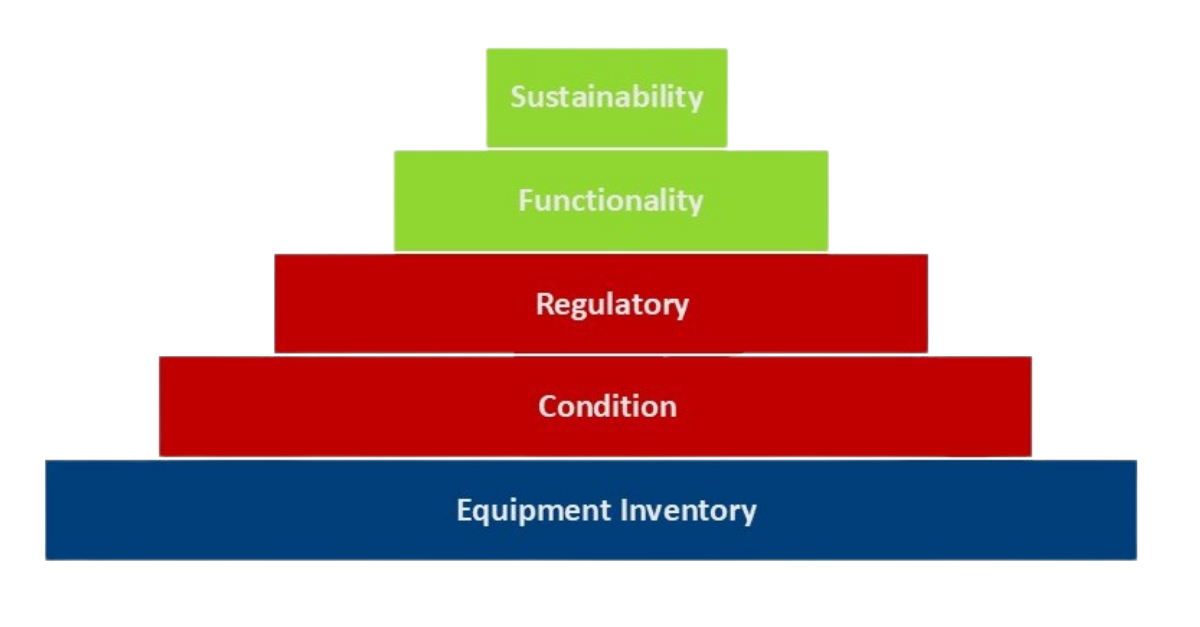
The pyramid organizes the key facility datasets from the ground up — starting with the most granular data at the base and working toward the broader, strategic datasets at the top. Each layer builds on the one below it. And all five layers matter when it comes to building the kind of consistent and defensible data foundation that AI tools can actually do something meaningful with.
Although each level of the pyramid stands alone, the real power that AI can unlock is when the datasets are integrated and AI can analyse them, looking for patterns and synergies to support better funding decisions.
Level 1 (Base): Equipment Inventory and Tagging (EI&T)
The foundation of the pyramid is your equipment inventory, the most granular dataset you manage within your facilities, even though it only looks at a subset of what makes up your buildings. A proper Equipment Inventory and Tagging (EI&T) dataset documents every individual piece of major mechanical and electrical equipment, with its own unique asset tag, nameplate data, installation date and maintenance-relevant details. This is what populates your Computerized Maintenance Management System (CMMS) and drives your Preventative Maintenance (PM) program. Without a current, complete equipment inventory, AI tools designed to predict failures or optimize maintenance schedules are working in the dark.
Level 2: Facility Condition Assessment (FCA) Data
Built on top of your equipment inventory is your condition data, typically developed through a Facility Condition Assessment (FCA). A good FCA dataset provides an element-level inventory of your buildings, structured to Uniformat II Level 3 or 4, with installation dates, remaining useful lives, current replacement values and condition ratings for every major building system and component. This is the dataset that drives your capital renewal forecasting and gives you a clear picture of your Deferred Capital Renewal and Maintenance (DCRM) backlog, both today and decades into the future. Outdated or incomplete FCA data is one of the most common, and most costly, gaps we encounter in the field.
Level 3: Regulatory and Code Data
The third layer covers the regulatory and code obligations that apply to your portfolio including: accessibility compliance, environmental hazards such as asbestos-containing materials (ACMs), building code issues and any other legislated requirements. Many organizations have a general awareness of their regulatory obligations but have not integrated that information into their capital planning process in any meaningful way. For AI tools to help you prioritize your capital renewal program intelligently, they need to know what projects carry regulatory risk or compliance urgency, and that requires having this data documented, current and connected to your other datasets.
Level 4: Programmatic and Functional Data
Moving up the pyramid, programmatic and functional data captures how your buildings are actually being used including: space utilization, program fit, occupancy levels and whether a facility is meeting the functional needs of the people inside it. A building in excellent physical condition that is fundamentally misaligned with its programmatic purpose is still a problem. Conversely, a functionally critical building with a high DCRM backlog may warrant accelerated investment. AI tools that are helping you prioritize across a large and complex portfolio need this context to generate recommendations that reflect organizational reality, not just physical condition.
Level 5 (Pinnacle): Sustainability and Energy Data
At the top of the pyramid sits your sustainability and energy data including: energy consumption, greenhouse gas emissions, energy intensity per square foot and performance against your organization’s sustainability targets. As climate commitments become increasingly central to institutional planning and public accountability, this dataset is rapidly moving from “nice to have” to essential. Additionally, the opportunity to optimize the indoor environment of a building for the benefit of its users presents a huge opportunity for organizations to differentiate themselves. If you don’t think that an optimized indoor environment can enhance learning, healing, productivity, satisfaction, you are missing out! AI tools are particularly well-suited to identifying efficiency opportunities and modeling the impact of different investment scenarios on your energy and emissions profile, but only if you have clean, current energy data to work with. An organization that has not done this foundational work will find that the AI’s sustainability recommendations are little more than educated guesses.
The good news is that most organizations already have some version of most of these datasets. The goal is not to start from scratch, it is to honestly assess what you have, identify the gaps, set a consistent standard and build a refresh cycle into your ongoing operations. So where does your organization sit on the pyramid, and how many of your five levels are truly current, complete and integrated with each other?
Next week, in our final post on the series, I will build on the definition of a consistent, defensible and integrated dataset we presented here to lay out the questions that you need to ask yourself in order to build your organization’s data strategy.


